Packet Monitor (PktMon) – Built-in Packet Sniffer in Windows 10
Packet Monitor (PktMon.exe) is a built-in network traffic analyzer (sniffer) that was introduced in Windows 10 1809 and Windows Server 2019. In the Windows 10 May 2020 Update (version 2004), many new features of the Packet Monitor were implemented (real-time packet capture is now supported, PCAPNG format support to easily import to Wireshark traffic analyzer). Thus, Windows has got a feature to capture network packets similar to that of tcpdump, and system or network administrators can use it to diagnose network operation and performance.
Packet Monitor allows you to get all network activity passing through the computer’s network interface on the network packet level.
Ealier, the netsh trace command was used to capture network traffic and inspect packets in Windows.
You can get help on pktmon.exe options and syntax by running the tool in the command prompt.

Here are the basic Packet Monitor commands:
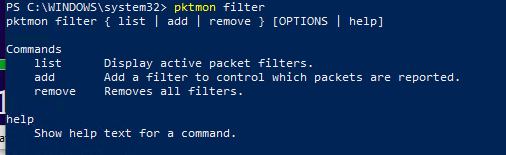
- filter —manage packet filters
- comp –manage registered components
- reset —reset packet counters
- start –start packet monitoring
- stop —stop packet monitoring
- format –convert the traffic log file to a text format
- pcapng –convert to the pcapng format
- unload –unload the PktMon driver
To get help on a subcommand, enter its name:
pktmon filter
Let’s try to collect a dump of the traffic coming to some running services on a Windows 10 device. Suppose, we want to analyze the FTP (TCP ports 20, 21) and HTTP (Ports 80 and 443) traffic.
Create a packet filter for TCP ports (also, you can track UDP and ICMP traffic):
pktmon filter add -p 20 21

pktmon filter add HTTPFilter –p 80 443
Display the list of active filters:
pktmon filter list

To run background traffic capture, run this command:
pktmon start –etw
Log file name: C:\Windows\System32\PktMon.etl
Logging mode: Circular
Maximum file size: 512 MB
Active measurement started.
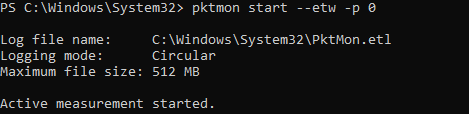
In this mode, pktmon collects data from all network interfaces, but only the first 128 bytes of a packet are logged. To capture the packets entirely on the specific computer interface, the following command is used:
pktmon start --etw -p 0 -c 9
where c value is the ID of the network interface you can get using this command:
pktmon comp list

The packet filter will write all traffic matching to the filters you have set to C:\Windows\System32\PktMon.etl (its maximum file size is 512 MB). To stop dump recording, run the following command:
pktmon stop
Also, network packets stop being collected after a Windows reboot.
Then you can convert the traffic dump file from ETL to the plain text format:
pktmon format PktMon.etl -o c:\ps\packetsniffer.txt
or
pktmon PCAPNG PktMon.etl -o c:\ps\packetsniffer.pcapng
You can analyze the traffic dump in the text format or import the ETL file to the Microsoft Network Monitor or WireShark (in the PCAPNG format) installed on the administrator’s computer.

To remove all Packet Monitor filters you have created, run this command:
pktmon filter remove
You can use PktMon to track network traffic in the real time. To do it, use the -l real-time parameter. In this mode, the captured packets are displayed in the console and are not written to the log file in the background.
pktmon start --etw -p 0 -l real-time

To stop traffic collection, press Ctrl+C.
If you see a packet loss (drop) in your network interface, PacketMon can show you the reason (for example, incorrect MTU or VLAN).
You can also use PktMon in Windows Admin Center using the extensions. The data you collect from computers or servers when diagnosing network issues may be used in more powerful software analyzing network traffic, like Microsoft Network Monitor or Wireshark.
powershell,virtualization,windows
via Windows OS Hub http://woshub.com
February 10, 2021 at 07:44AM
admin
